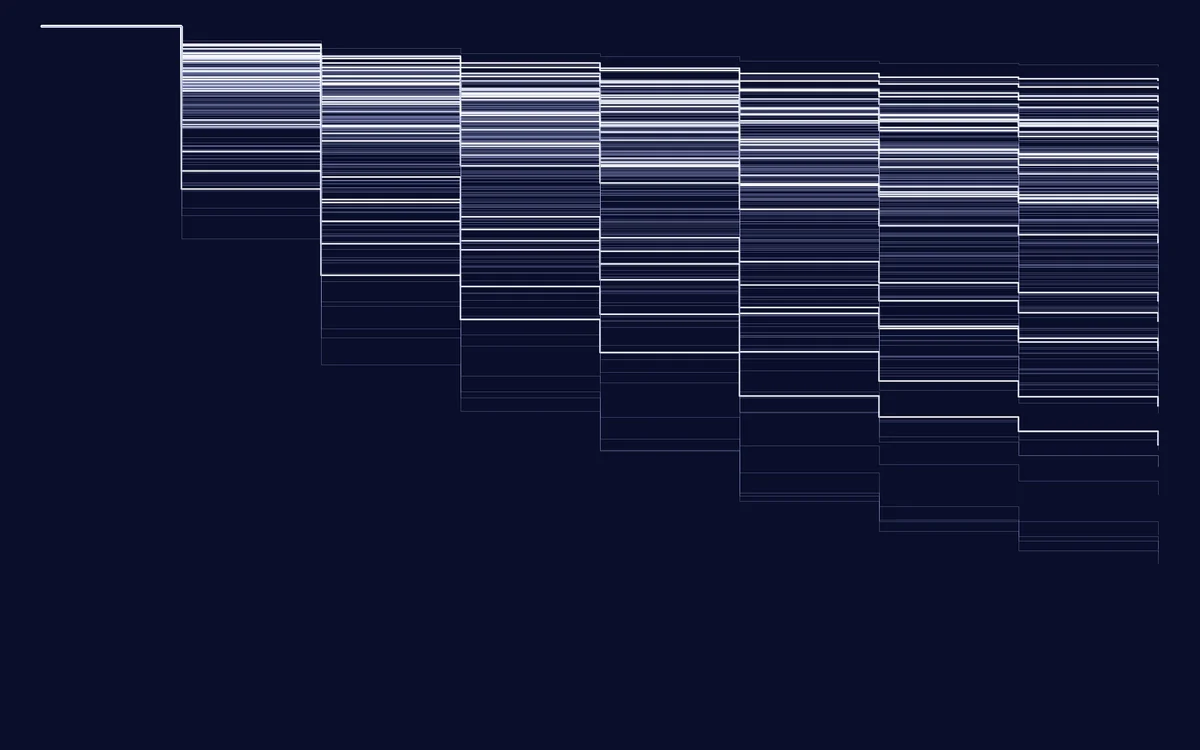
When a principal asks an analytics team for an attrition model, the request usually arrives as a classification problem: here are last year’s students, here is who left, predict who will leave. The framing is natural and it is wrong in two ways that matter. It throws away the timing of departure, which is the only thing an advisor can act on, and it quietly mislabels every student whose story has not finished yet.
This paper sets out the alternative that the event-history literature has used for decades and that higher education analytics mostly has not: model the hazard, the probability of leaving in a given term among students still enrolled at its start. We build it, compare it with the snapshot approach on a simulated college where the truth is known, and report where it helps, where it does not, and the one place a fashionable model choice made no difference at all.
Two questions that look like one
A snapshot classifier answers: given what we knew in the first term, will this student eventually leave? A hazard model answers: given everything we know at the start of term t, how likely is this student to leave during term t, assuming they have stayed until now? The second question has three properties the first lacks.
- It is conditional on survival. A student in their seventh semester has already survived the risky first year. A snapshot score computed at entry cannot know that; a hazard can.
- It updates. The covariates are allowed to change: last term’s attendance, the change in grade point average, whether fees have fallen into arrears. A score that is never recomputed decays as the information it was built on ages.
- It handles incomplete histories correctly. A student who entered in 2017 and is still enrolled in 2019 has contributed four terms of risk and no event. That is information, not a label of ‘stayer’.
The model
Let Ti be the semester in which student i leaves. The discrete-time hazard is the conditional probability of leaving in term t given enrolment at its start, and we model it on the logit scale with a separate baseline for every term and covariates that may vary over time:
Here xi holds fixed attributes known at entry (standardised board marks, first-generation status, commuting time, enrolment in a deferred-fee scheme) and zi,t−1 holds the record as it stood at the end of the previous term (attendance, grade point average, its change, months of fee arrears). The lag is not a detail. A model that uses this term’s marks to predict departure during this term looks excellent on paper and is useless in practice, because the marks arrive after the student has gone.
Singer and Willett showed in 1993 that the likelihood for (1) factorises into a product of Bernoulli terms over person-periods, so it can be fitted with ordinary logistic regression once the data are expanded to one row per student per term at risk:
where ci is the last term in which the student was observed (their departure term, or the censoring point) and yit is one only in the term of departure. Censored students contribute exactly the terms they were seen for and nothing more. The survival function and the cumulative probability of departure by term t follow directly:
Nothing here is new. The point of this paper is that it is rarely done, and that the consequences of not doing it are large enough to change what an institution should buy.
The simulated college
The baseline hazard is deliberately non-monotone. Departures peak at the end of the first year, when the first annual results arrive, fall through the second year, and rise again in the fifth semester, where many affiliated colleges see students leave after a disappointing third-year result or for an employment offer. The observed term hazards in the simulated data are shown below.
An unobserved shock to engagement within each term also drives departure. It is there because real departures always contain a component that no administrative record anticipates, and a simulation without one would flatter every model.
Result 1: the label problem is a bias problem
The snapshot approach needs a label for every student, and the only labels available for the 2017 and 2018 cohorts are ‘has not left yet’. The common practice is to call them stayers. The figure below shows what that does to the most basic quantity an institution reports, the four-year departure rate.
Counting censored students as stayers understates departure by 5.4 points, or 18% in relative terms. The discrete-time life table, which uses each cohort only for the terms it was actually observed, recovers the truth to within 0.4 points. The snapshot classifier inherits the bias in its labels: its mean predicted probability of eventual departure on held-out students is 24.1%, against a true 30.3% for those same students. It is not merely imprecise. It is calibrated to a number that is wrong by construction, and the error grows with the share of recent cohorts in the training data, which is exactly the share an institution most wants to use.
A model trained on labels that treat ‘not yet’ as ‘never’ will tell you that attrition is falling every year, because every year the most recent cohorts have had the least time to leave.
Result 2: snapshot scores age, hazards do not
To compare ranking ability fairly we evaluate every model in the same way: in each semester, among held-out students enrolled at its start, how well does the score separate those who leave during that semester from those who do not. This is the incident/dynamic AUC of Heagerty and Zheng, computed term by term.
The first-term snapshot holds at 0.74 to 0.75 through the first two years and then decays to 0.65 by semester 8, because the record it was built on describes a student who no longer exists. Refreshing its inputs every term recovers most of the ranking ability, which is worth knowing: a team that cannot rebuild its pipeline can get a long way by simply rescoring. But a refreshed snapshot is still trained to answer ‘ever’, so it overweights fixed attributes that predict early departure and underweights the recent signals that predict departure now. The logistic hazard sits within 0.01 of the oracle in every term.
The first semester is the exception. With no prior-term record, every model is working from entry attributes alone and all of them land between 0.70 and 0.72. Nothing in the modelling literature fixes a lack of information.
Result 3: lead time is what advisors buy
An AUC does not tell an advisor how many students they will reach in time. We therefore simulate the operational policy: at the start of each semester, flag the 15% of enrolled students with the highest score, and record for each eventual leaver whether, and how early, they were flagged before departing.
| Model | Leavers flagged | Flagged a term or more ahead | Mean lead (terms) | Calibration slope |
|---|---|---|---|---|
| First-term snapshot | 39.3% | 28.3% | 1.57 | — |
| Snapshot, refreshed each term | 49.1% | 31.8% | 1.40 | — |
| Logistic hazard | 56.1% | 36.3% | 1.43 | 1.00 |
| Boosted hazard | 55.1% | 35.8% | 1.42 | 1.01 |
| Oracle (true hazard) | 56.5% | 37.1% | 1.39 | 1.01 |
The hazard model reaches 56% of leavers before they go, against 39% for the first-term snapshot, at an identical advising workload. The snapshot’s higher mean lead time is not a virtue: it comes from the students it catches being disproportionately the early, obvious departures, flagged in the first term and gone in the second. The hazard model catches more of the students whose risk only becomes visible later, which is where an advisor’s time is most valuable and least likely to be spent.
It is worth being plain about the ceiling. Even the oracle, which knows the true hazard, reaches only 57% of leavers and only 37% a full term ahead. The rest leave because of the within-term shock that no record anticipates. Any vendor who reports early-warning recall far above this, on data that looks like ours, is either measuring after the fact or measuring something else.
Result 4: the boosted model bought nothing
We fitted the same person-period data with gradient-boosted trees (term index as a feature, 250 rounds, leaf constraints tuned on a validation fold). It matched the logistic hazard to within a point on every metric and was very slightly worse on AUC in late terms. This is not a general verdict on boosting: the simulated hazard is additive on the logit scale, which is the logistic model’s home ground. It is a specific verdict on the order of operations. The framing (hazard against snapshot, lagged against concurrent covariates, honest censoring) moved catch rate by 17 points. The model family moved it by one.
There is also a practical argument for the simpler model. The logistic hazard’s coefficients are readable by the people who must act on it. On the training data it recovered the generating process closely: the coefficient on last-term attendance was −2.10 against a true −2.10, on grade point average −0.35 against −0.38, and the term baselines reproduced the first-year peak and the semester-5 bump. An advisor can be told, in a sentence, that a fall of ten points in attendance multiplies the odds of leaving next term by about 1.23.
What this implies for practice
- Build attrition models as hazard models on person-period data, with covariates lagged to what was known at the start of the term being predicted.
- Report departure rates from a life table, not a count of leavers over a headcount. A college’s own trend chart is the first thing the censoring bias distorts, and it distorts it in the comforting direction.
- Recompute scores every term, and do not show an advisor a score older than one term.
- Report catch rate and lead time at the advising capacity the college actually has, not AUC alone. A college with two advisors and 3,000 students should see the number for a 5% flag rate, not 15%.
Method
Limitations
The simulation is kinder to every model than reality will be in one important respect: censoring here is purely administrative. In real colleges some students transfer, some are struck off for non-payment and later return, and some vanish from the record without a recorded exit; each of these is informative censoring, which biases the life table as well. We also treat departure as a single event type. Transfer to another institution and withdrawal from higher education are different outcomes with different remedies, and a competing-risks formulation, with a cause-specific hazard for each, is the natural extension. Finally, the data-generating process is additive on the logit scale, which favours logistic regression; the null result for boosting should be read as ‘framing first’, not ‘never use trees’.
Simulated data only. No student record from any institution was used in this paper. The simulation script, its seed and the person-period expansion code are published so that every figure can be regenerated. Write to team@eduplatter.com.
Related work
The discrete-time formulation is Singer and Willett’s [1, 2], who made the case for it in educational research a quarter of a century ago, and rests on Allison’s treatment of event histories as person-period logistic regression [5]. Cox [3] and Kaplan and Meier [4] supply the continuous-time analogues. Heagerty and Zheng [6] define the time-dependent ROC curves we use to evaluate ranking at each term. Ameri and colleagues [7] applied survival models to early prediction of student dropout and are the closest prior work; we add the explicit censoring-bias measurement, the lag discipline and the operational catch-rate comparison. Ishwaran and colleagues [8] describe random survival forests, the tree-based alternative we did not need here. Tinto [9] remains the reason to expect timing to matter at all.
Artefacts
Everything below is published or available on request. A number nobody can reproduce is an advertisement, not a result. Real institutional records are never shareable under our processor obligations, so where that applies we release a simulated corpus that reproduces the qualitative finding.
References
- Singer, J. D., & Willett, J. B. (1993). It’s About Time: Using Discrete-Time Survival Analysis to Study Duration and the Timing of Events. Journal of Educational Statistics, 18(2), 155–195.
- Singer, J. D., & Willett, J. B. (2003). Applied Longitudinal Data Analysis: Modeling Change and Event Occurrence. Oxford University Press.
- Cox, D. R. (1972). Regression Models and Life-Tables. Journal of the Royal Statistical Society, Series B, 34(2), 187–220.
- Kaplan, E. L., & Meier, P. (1958). Nonparametric Estimation from Incomplete Observations. Journal of the American Statistical Association, 53(282), 457–481.
- Allison, P. D. (1982). Discrete-Time Methods for the Analysis of Event Histories. Sociological Methodology, 13, 61–98.
- Heagerty, P. J., & Zheng, Y. (2005). Survival Model Predictive Accuracy and ROC Curves. Biometrics, 61(1), 92–105.
- Ameri, S., Fard, M. J., Chinnam, R. B., & Reddy, C. K. (2016). Survival Analysis Based Framework for Early Prediction of Student Dropouts. ACM CIKM.
- Ishwaran, H., Kogalur, U. B., Blackstone, E. H., & Lauer, M. S. (2008). Random Survival Forests. Annals of Applied Statistics, 2(3), 841–860.
- Tinto, V. (1993). Leaving College: Rethinking the Causes and Cures of Student Attrition (2nd ed.). University of Chicago Press.
- Steyerberg, E. W. (2009). Clinical Prediction Models: A Practical Approach to Development, Validation, and Updating. Springer.
Bhardwaj, M. (2019). Time to departure: discrete-time hazard models for student attrition. EduPlatter Research, EPR-2019-01.